Features
Detailed breakdown of every TrendCast feature.
Dashboard (New Tab Override)
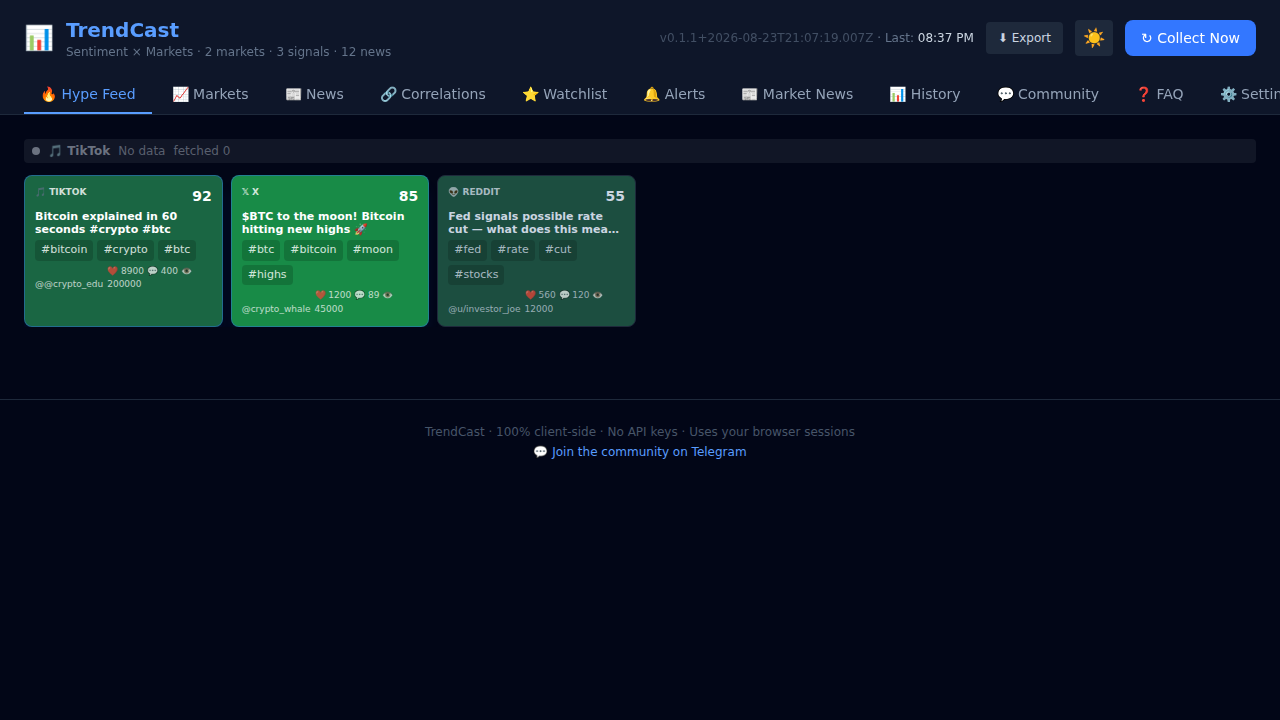
🔥 Hype Feed
The default tab when you open a new tab. Shows trending social signals from X (Twitter), Reddit, and TikTok in a responsive grid.
- Virality sorting — Cards are sorted by virality score (derived from likes, shares, comments, and views) in descending order.
- Sentiment heatmap — Tile background colour reflects sentiment: green = bullish, red = bearish, slate = neutral.
- Engagement metrics — Each card shows likes, comments, and view counts.
- Clickable links — Cards with URLs are links that open the original post in a new tab.
- Highlight threshold — Posts above your configured virality threshold are visually highlighted.
📈 Market Odds
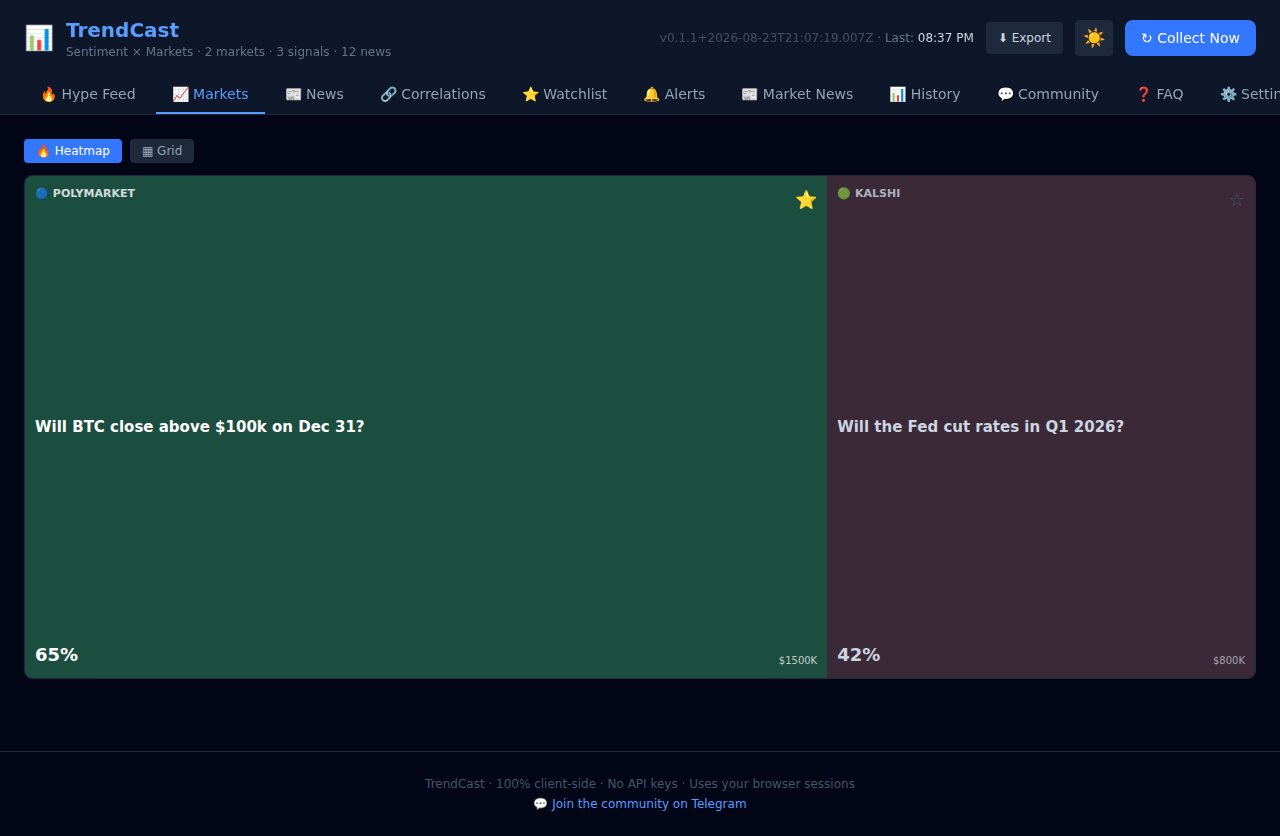
Prediction market contracts from Polymarket and Kalshi displayed as a treemap heatmap — inspired by Yahoo Finance’s stock heatmap.
- Tile size ∝ volume — Bigger tiles = higher 24h trading volume.
- Tile colour ∝ Yes probability — Green = high Yes, red = high No, slate = ~50/50.
- Star toggle — Click the star on any market to add it to your watchlist.
- Platform badges — 🔵 Polymarket, 🟢 Kalshi.
📰 News Feed
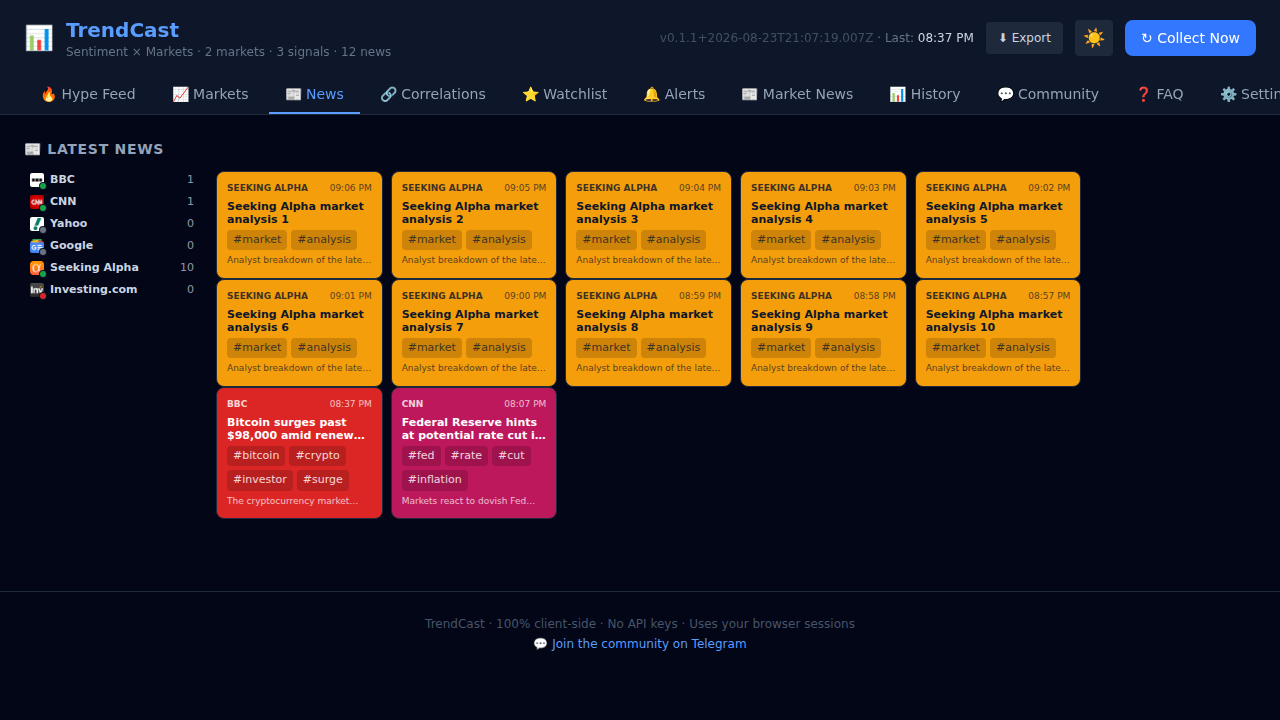
Latest headlines from BBC, CNN, Yahoo Finance, and Google News.
- Source badges — Colour-coded by source (BBC red, CNN dark red, etc.).
- Thumbnail images — When available, a thumbnail is shown.
- Time-sorted — Newest first.
- No login required — News is fetched via public RSS feeds.
🔗 Correlations
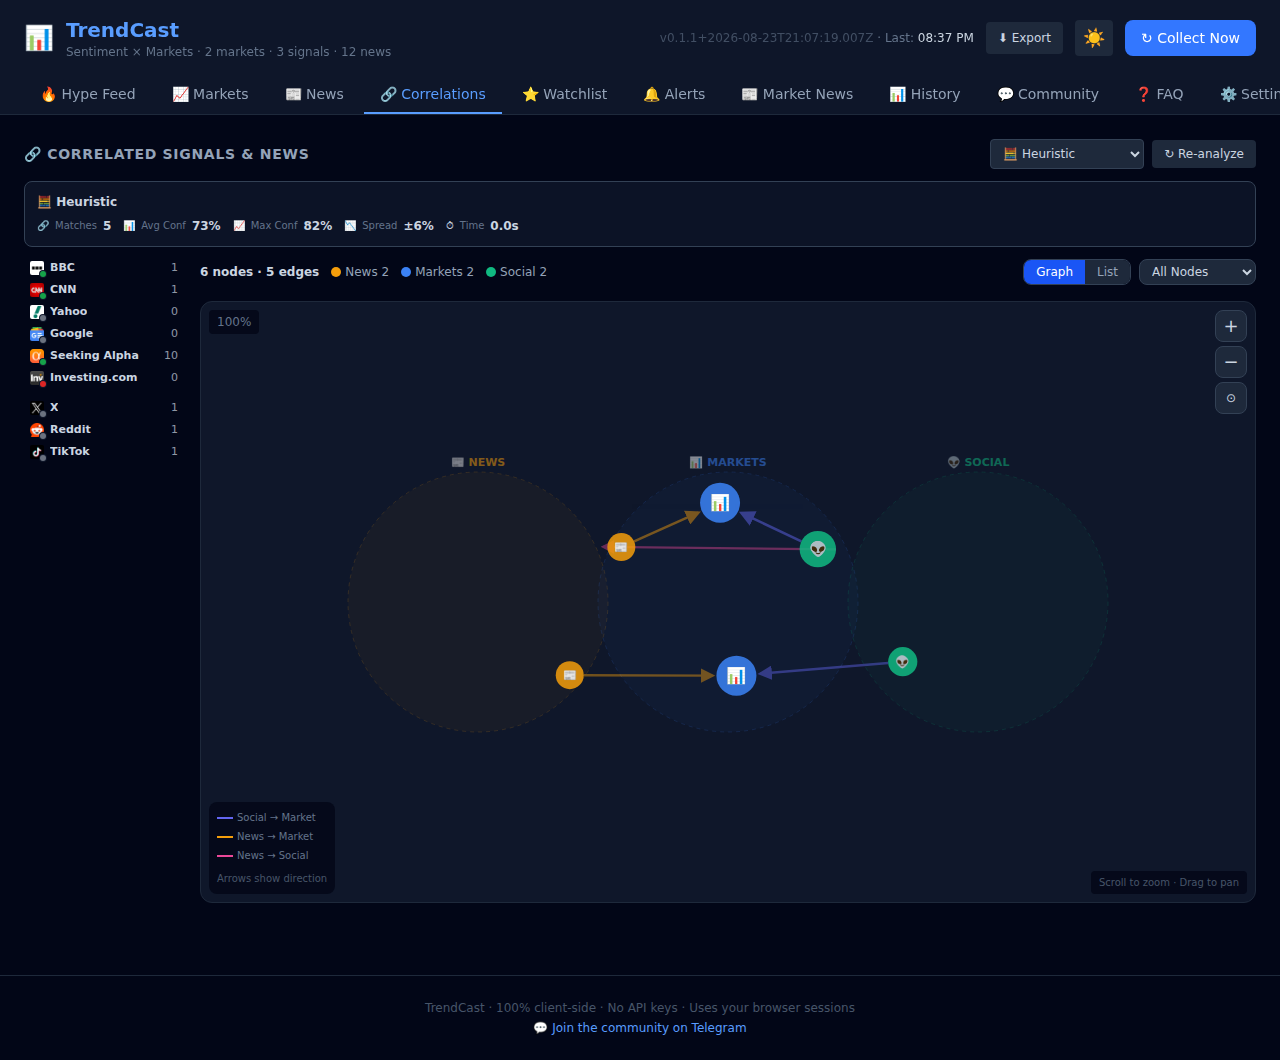
A force-directed network graph showing how social signals, news, and market contracts connect.
- Three node types — 📰 News, 📊 Markets, 👽 Social signals.
- Directed edges — Arrows show causal/temporal flow:
- News → Social: news published before social post
- Social → Market: social signal correlates with market contract
- News → Market: news headline correlates with market contract
- Five correlation engines:
- 🧮 Heuristic — NER + keyword Jaccard similarity. Fast, no download.
- 🧠 Embedding — Semantic similarity via transformer embeddings.
- 📊 Sentiment — Sentiment-aware matching via transformer classifier.
- 🏷️ ML NER — Transformer-based named entity extraction.
- 🤖 LLM — LLM-based correlation scoring.
- Progress bar — ML engines show real-time progress with phase labels.
- Stats bar — Match count, avg/max confidence, spread, elapsed time.
- Run history — Table of past correlation runs for model comparison.
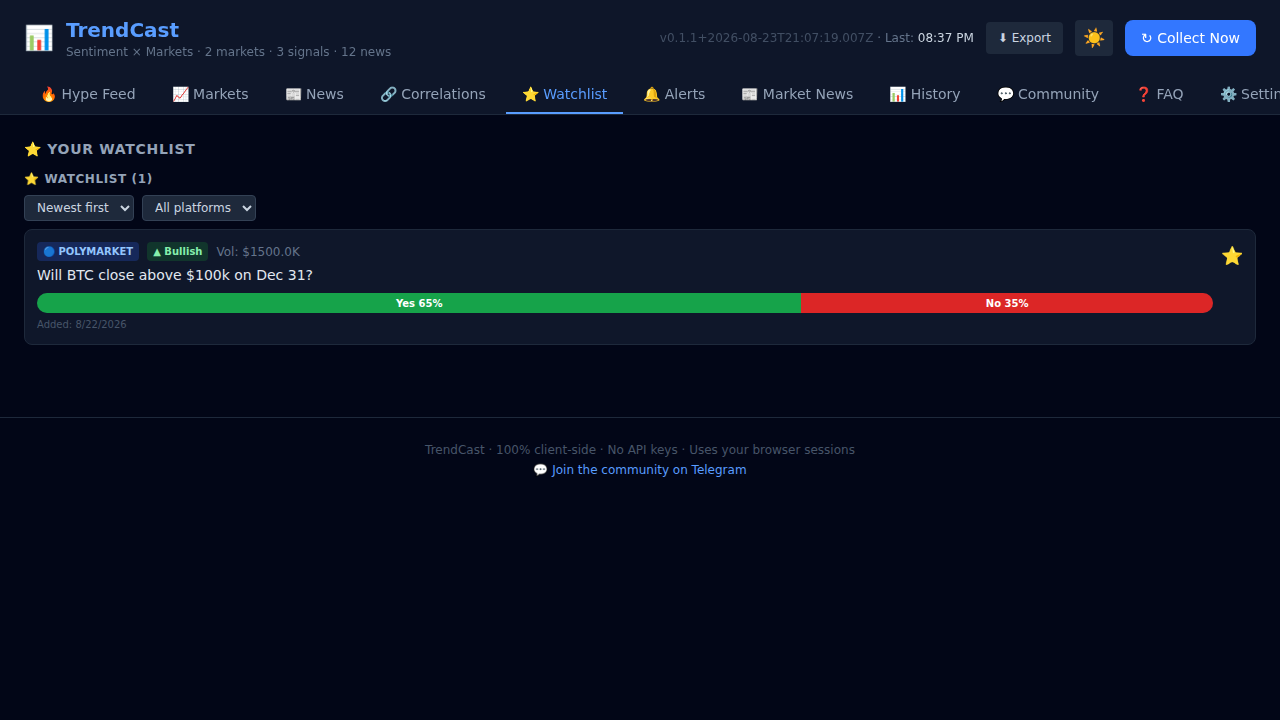
⭐ Watchlist
Markets you have starred for personal tracking.
- Persists in
chrome.storage.localacross sessions. - Shows platform badge, question, and when you added it.
- Quick-remove via the star toggle.
📊 History Charts
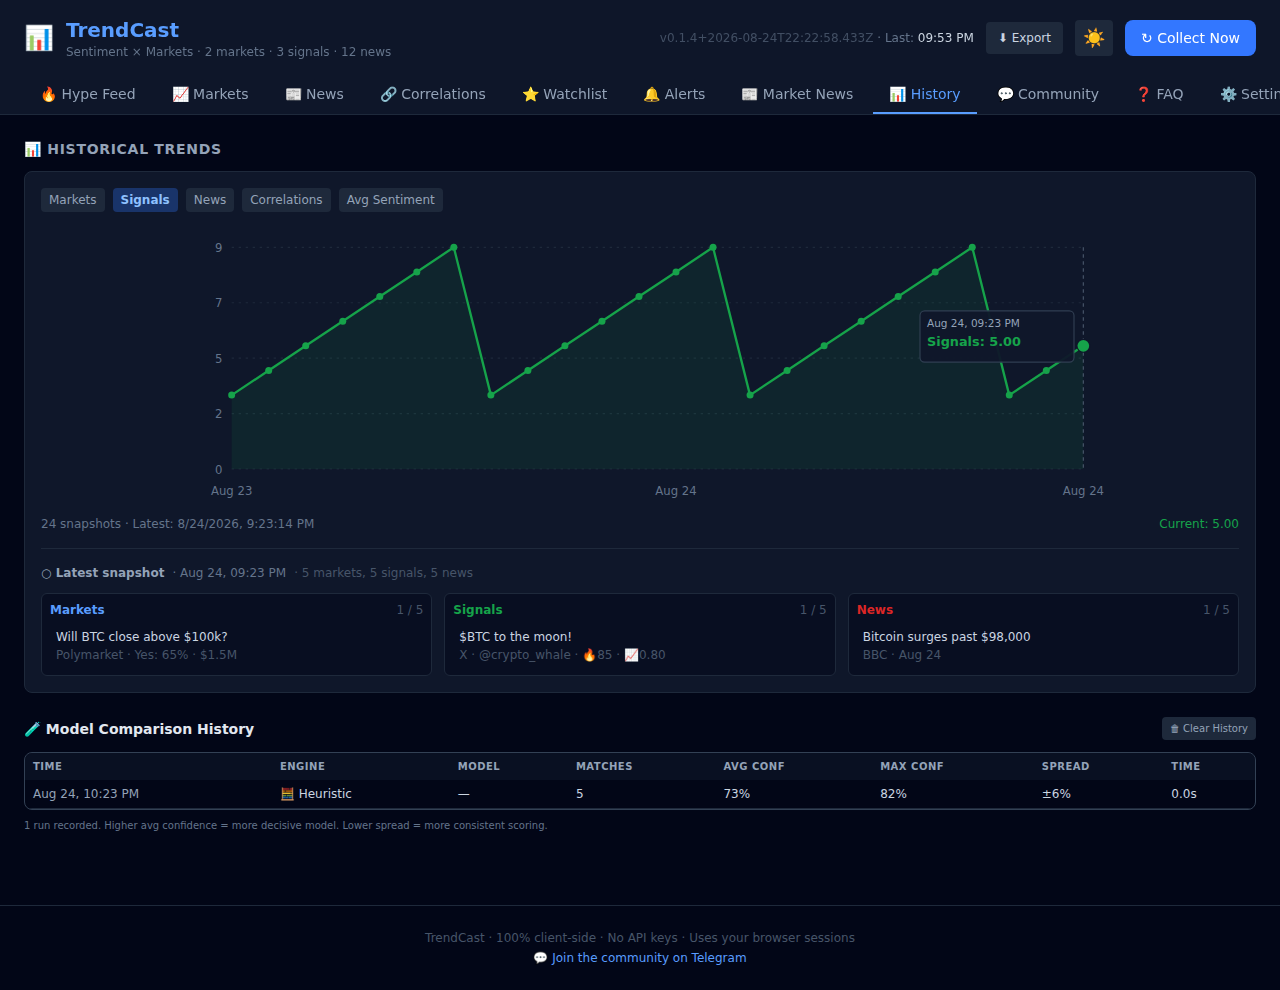
Historical collection trends rendered as interactive SVG line charts.
- Metric selector — Switch between Markets, Signals, News, Correlations, and Avg Sentiment.
- Hover tooltip — Vertical crosshair with exact values.
- Detail panel — Shows top markets, signals, and news for the hovered snapshot with clickable links.
- No charting library — Pure SVG, no external dependencies.
💬 Community
Links to the TrendCast Telegram group and GitHub Issues page for bug reports and feature requests.
❓ FAQ
In-app FAQ explaining the six correlation engines, how they work, and when to use each one.

⚙️ Settings
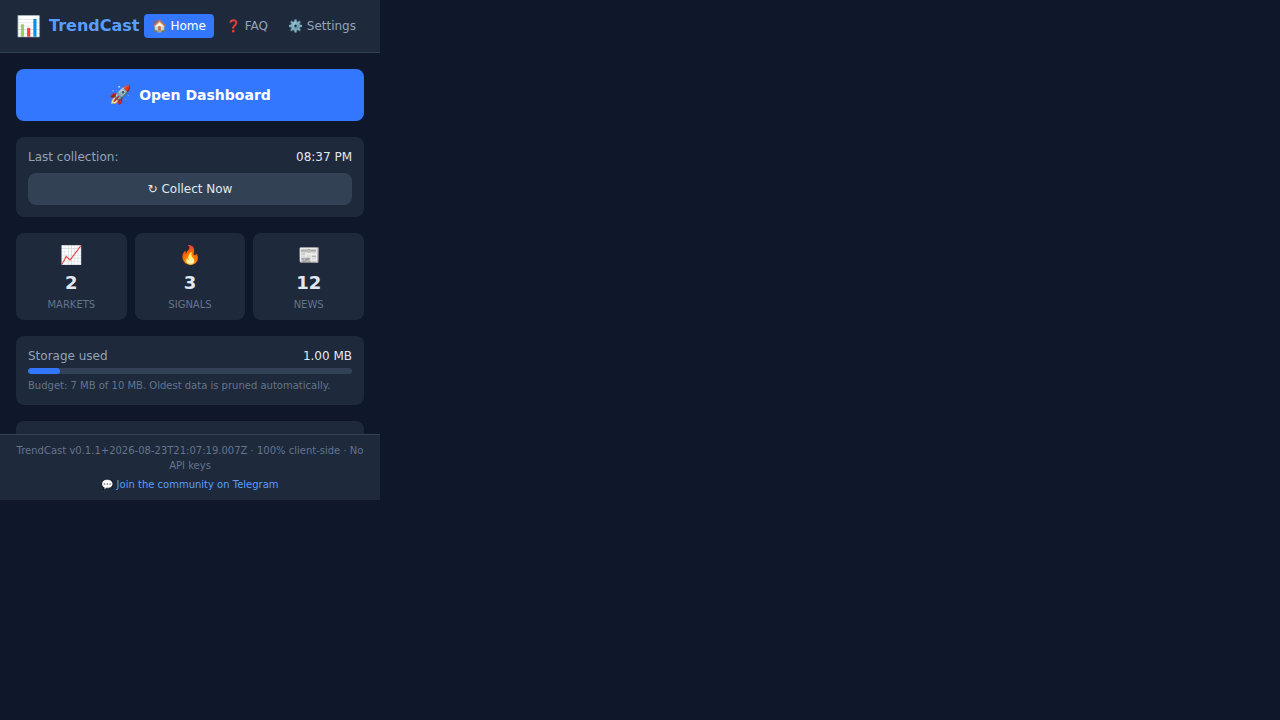
Configure every aspect of TrendCast:
- Collection interval — 5 to 1440 minutes (default: 60 = hourly).
- Enabled sources — Toggle Polymarket, Kalshi, X, Reddit, TikTok, BBC, CNN, Yahoo Finance, Google Finance individually.
- Highlight threshold — Virality score threshold for highlighting posts.
- Correlation engine — Choose from 6 engines.
- ML model selection — Pick specific models for each ML engine.
- Reddit subreddits — Customise which subreddits to scrape.
- New tab override — Enable/disable the dashboard as new tab page.
Popup (Toolbar Quick-Launcher)
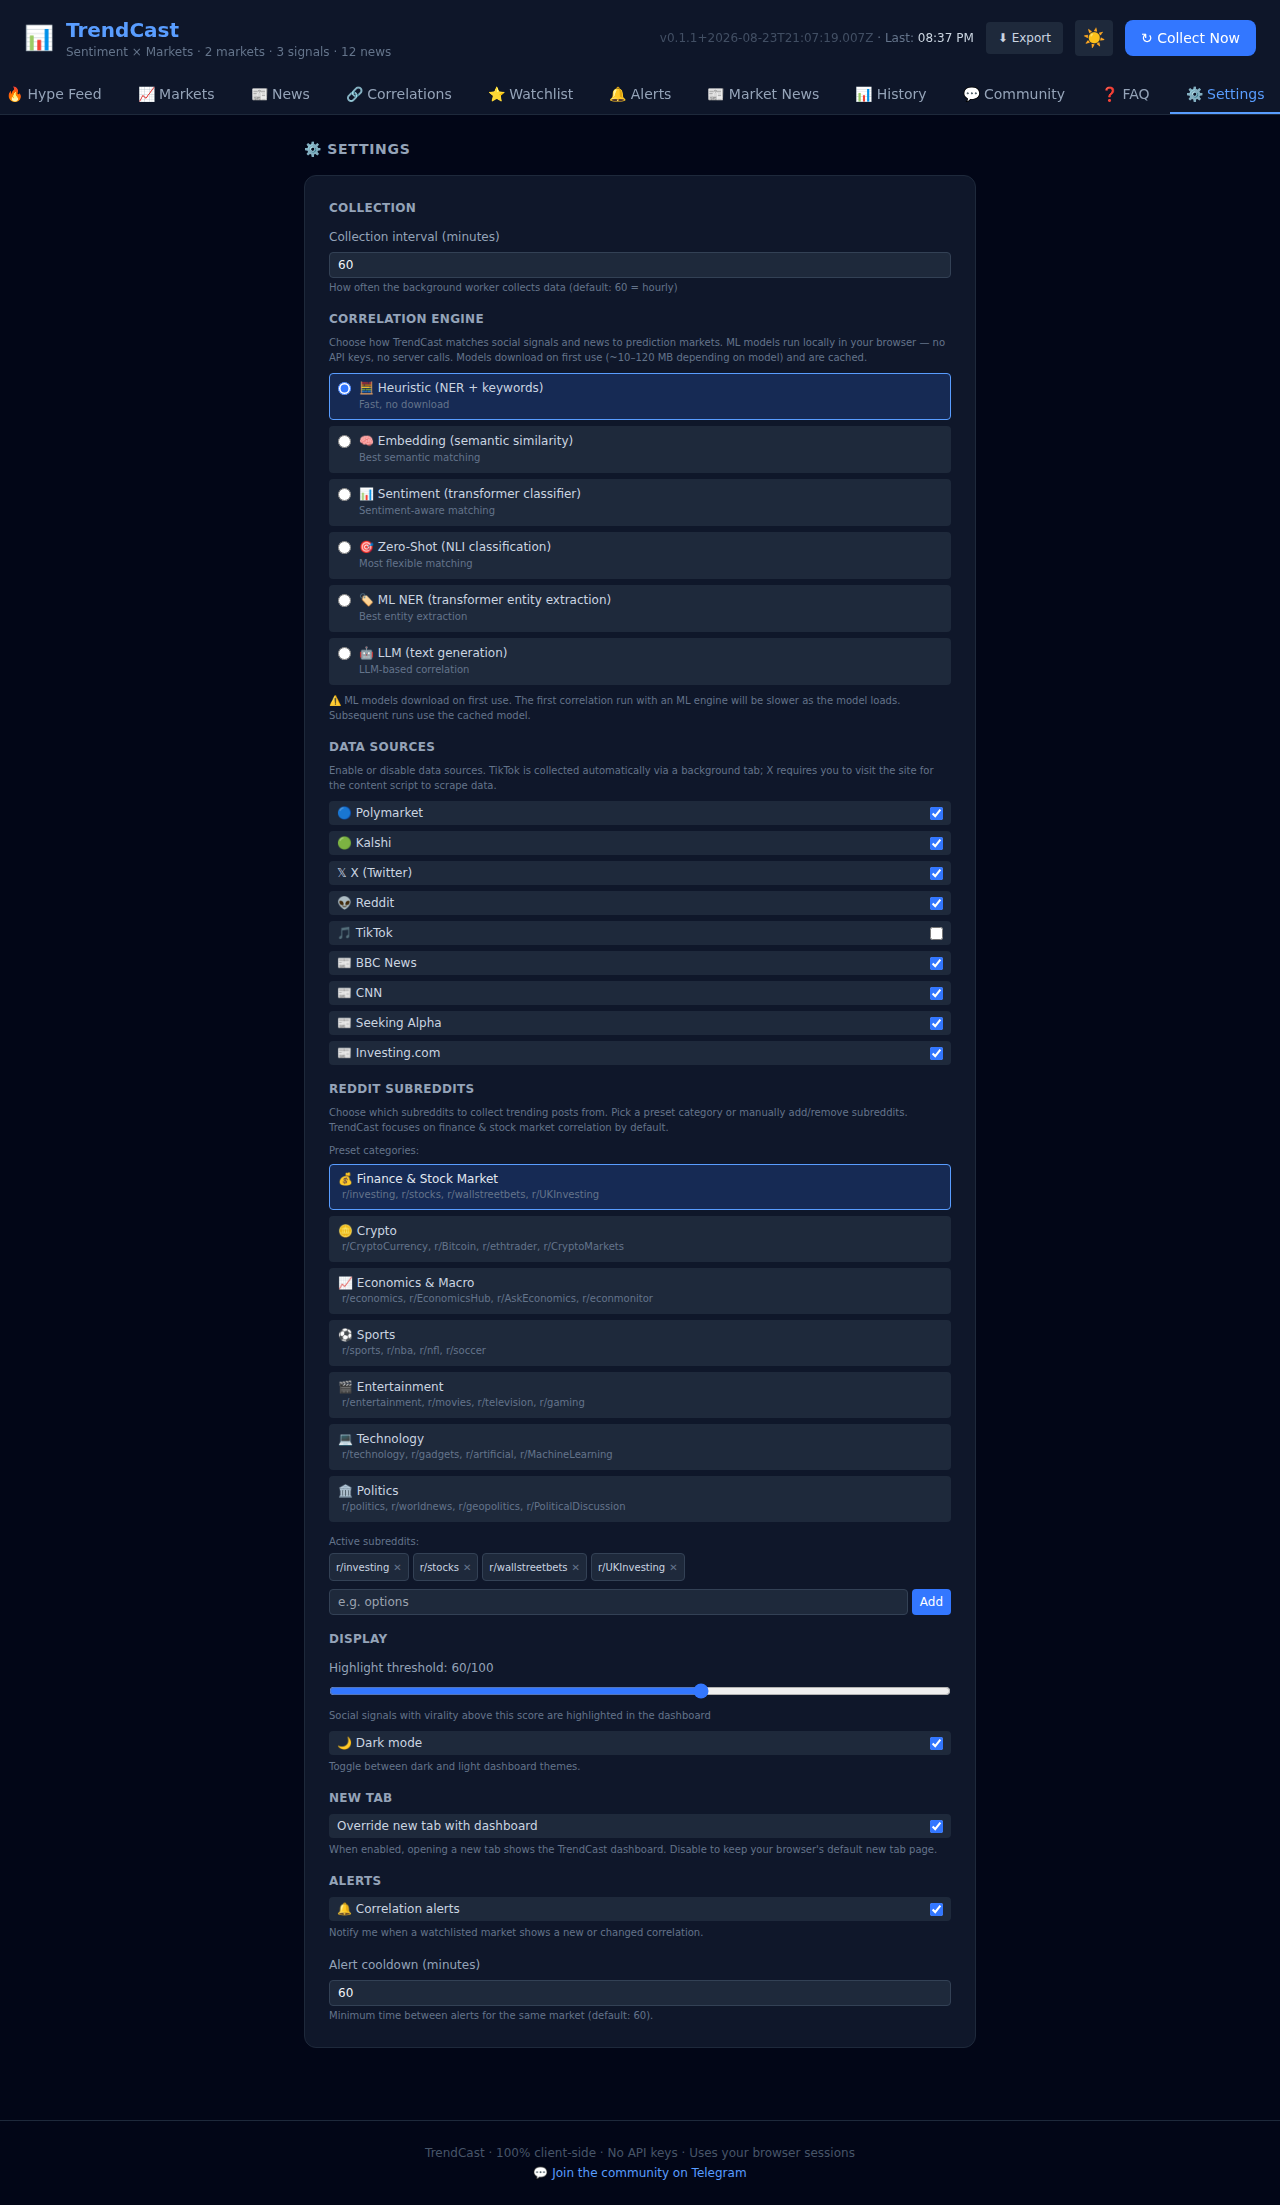
The popup is a compact 380×500px panel accessible from the toolbar icon.
- Open Dashboard — One-click access to the full dashboard.
- Collect Now — Trigger manual data collection.
- Quick stats — Markets, signals, and news counts at a glance.
- Storage usage indicator — Shows MB used with a colour-coded bar (green/amber/red) and budget info.
- Active sources — Badges showing which data sources are enabled.
- FAQ tab — Compact FAQ for quick reference.
- Settings tab — Quick access to source toggles and collection interval.
Odds Overlay
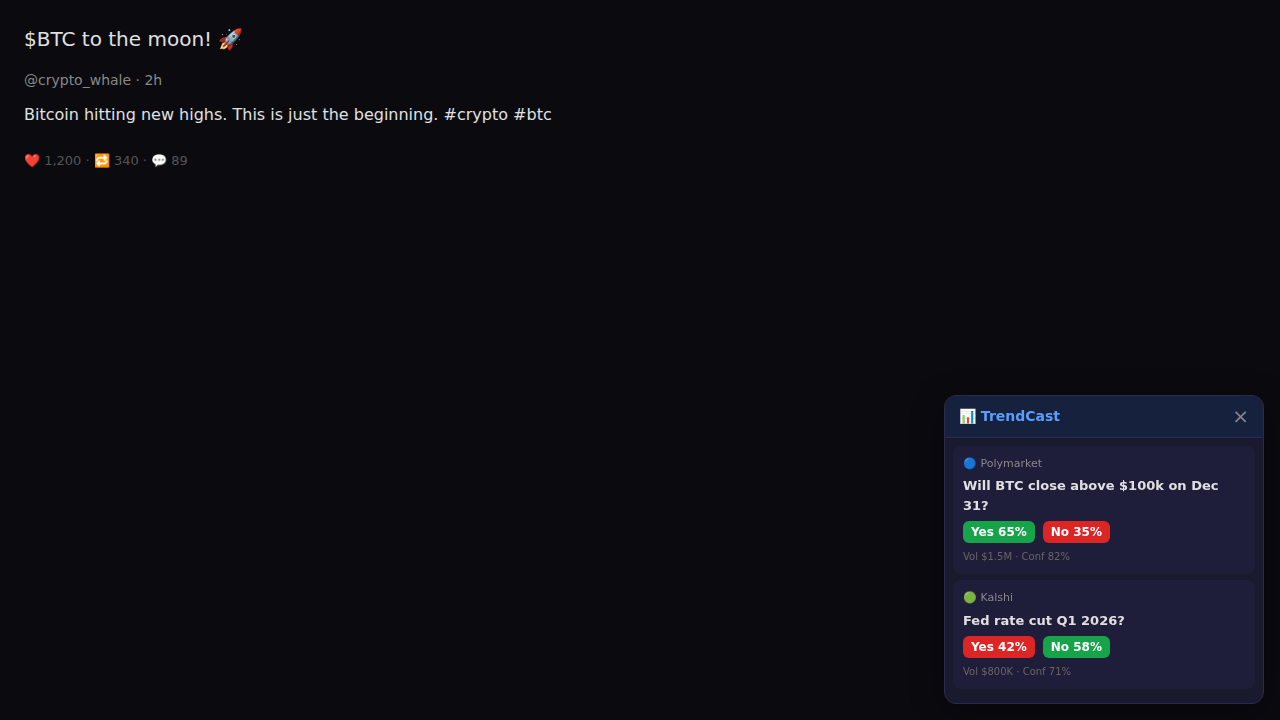
When you browse X, Reddit, or TikTok, a floating overlay appears in the bottom-right corner showing correlated prediction market odds for the content you’re reading.
- Scoped styles —
.trendcast-overlayprefix avoids conflicts with social platform CSS. - High z-index — Stays above platform UI.
- Closeable — Click × to dismiss.
- Real-time — Updates as you scroll to new posts.
Background Collection
chrome.alarms-based — Survives service worker termination (MV3).- Hourly by default — Configurable from 5 minutes to 24 hours.
- Rate-limited — Token-bucket rate limiter prevents API abuse.
- All public APIs — No authentication needed for any source.
Data Export
- CSV — Spreadsheet-friendly format.
- JSON — Full structured data for programmatic use.
- Client-side download — No server round-trip.